- Published on
- Fall 2021
Rhythmic Breathing Trainer
A rhythmic auditory breathing trainer that incorporates entrainment and a gamified user interface for instantaneous feedback


Role
Electrical Engineer, Systems Engineer
Skills Used
- CAD in OnShape
- Circuitry
- PCB design in KiCad
- Arduino C++
- Agile Project Management
Collaborators
Rachel Lopez, Haley Snyder, Claire Szuter
Background
In Medical Device Design II, MedRhythms, a digital therapeutics company that works closely with neurologic music therapists (NMTs), chartered my team to create an entertaining breathing trainer for patients suffering from dysarthria that included elements of rhythmic entrainment and visual/auditory feedback.
Links
Problem Statement
Increase neurologic music therapy treatment compliance for patients suffering from Dysarthria as a result of neurological injury (TBI and stroke) or neurodegenerative conditions (Parkinson's and MS) in order to improve respiratory capacity and endurance.
Key Features
- A Guitar Hero-esque user interface with a moving graph to show inhales and exhales
- Live music with metronome-synced beats for inhaling, exhaling, and resting
- Ability to store session information, including number of good inhales and exhales
- A hot wire anemometer interfacing with an Arduino on a PCB
- A calibration button that allows for adequate anemometer readings
- An elegant, ergonomic enclosure with corrugated tubing and a comfortable mouthpiece
- A rotating air resistance endpiece to change breathing difficulty
- A long-lasting easily-replacable battery and LED power indicator
House of Quality and Specifications


CAD Design
Enclosure Design


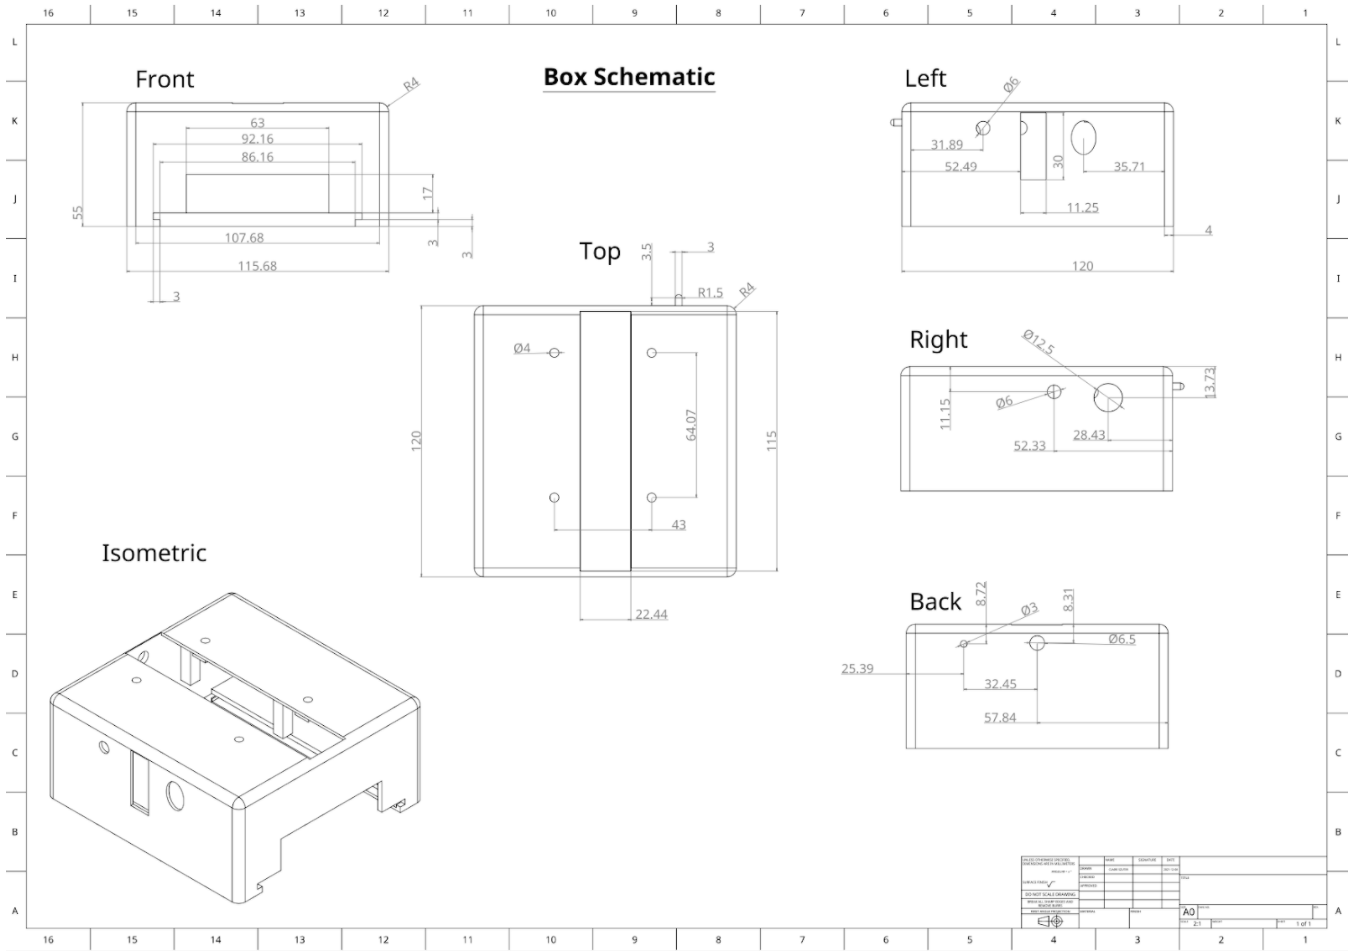
Drawing of enclosure
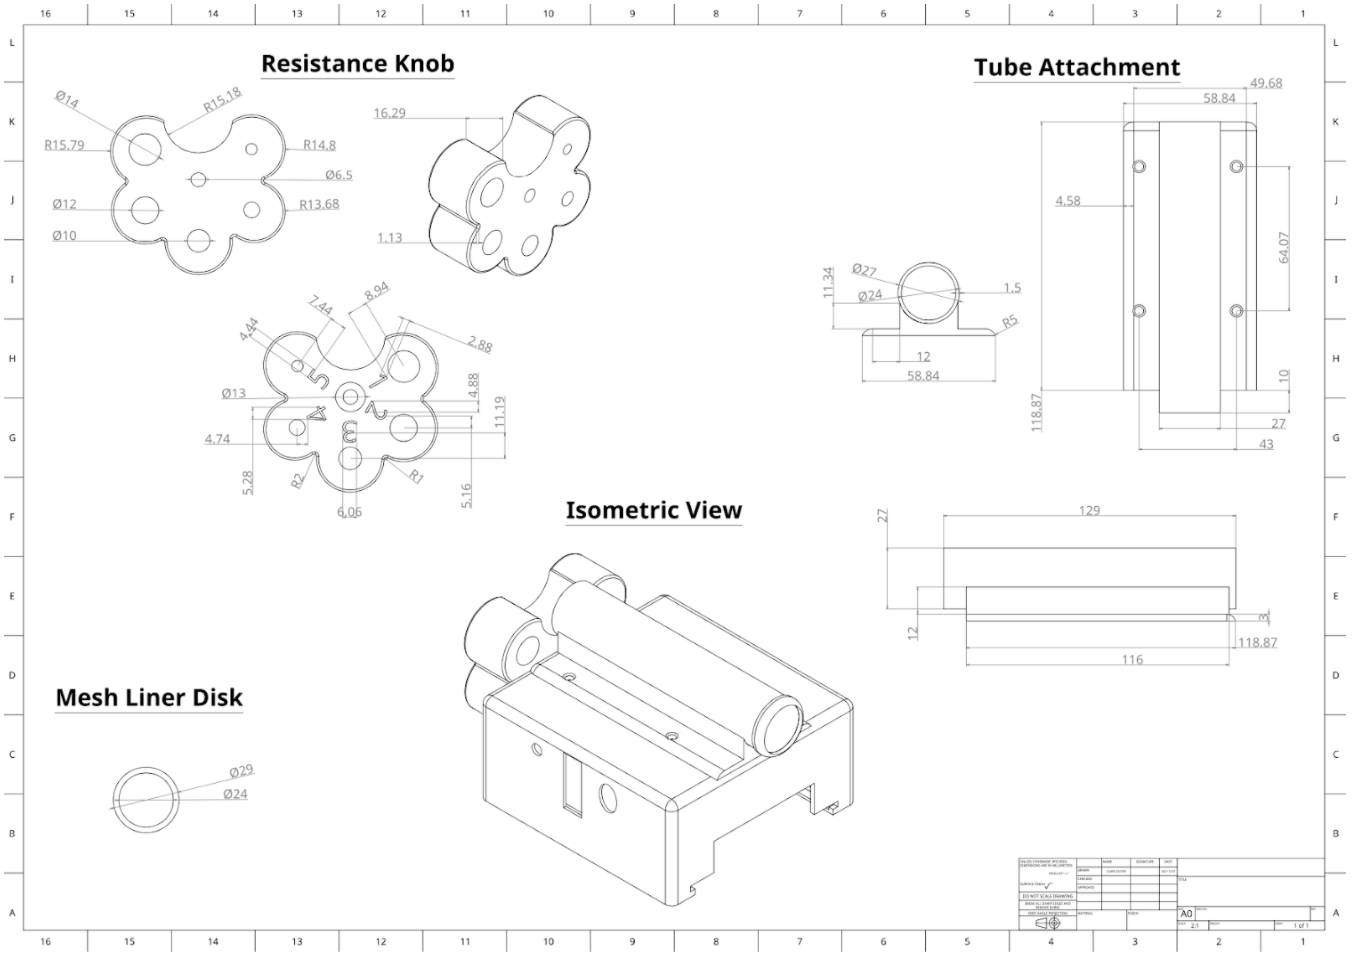
Drawing of resistance knob
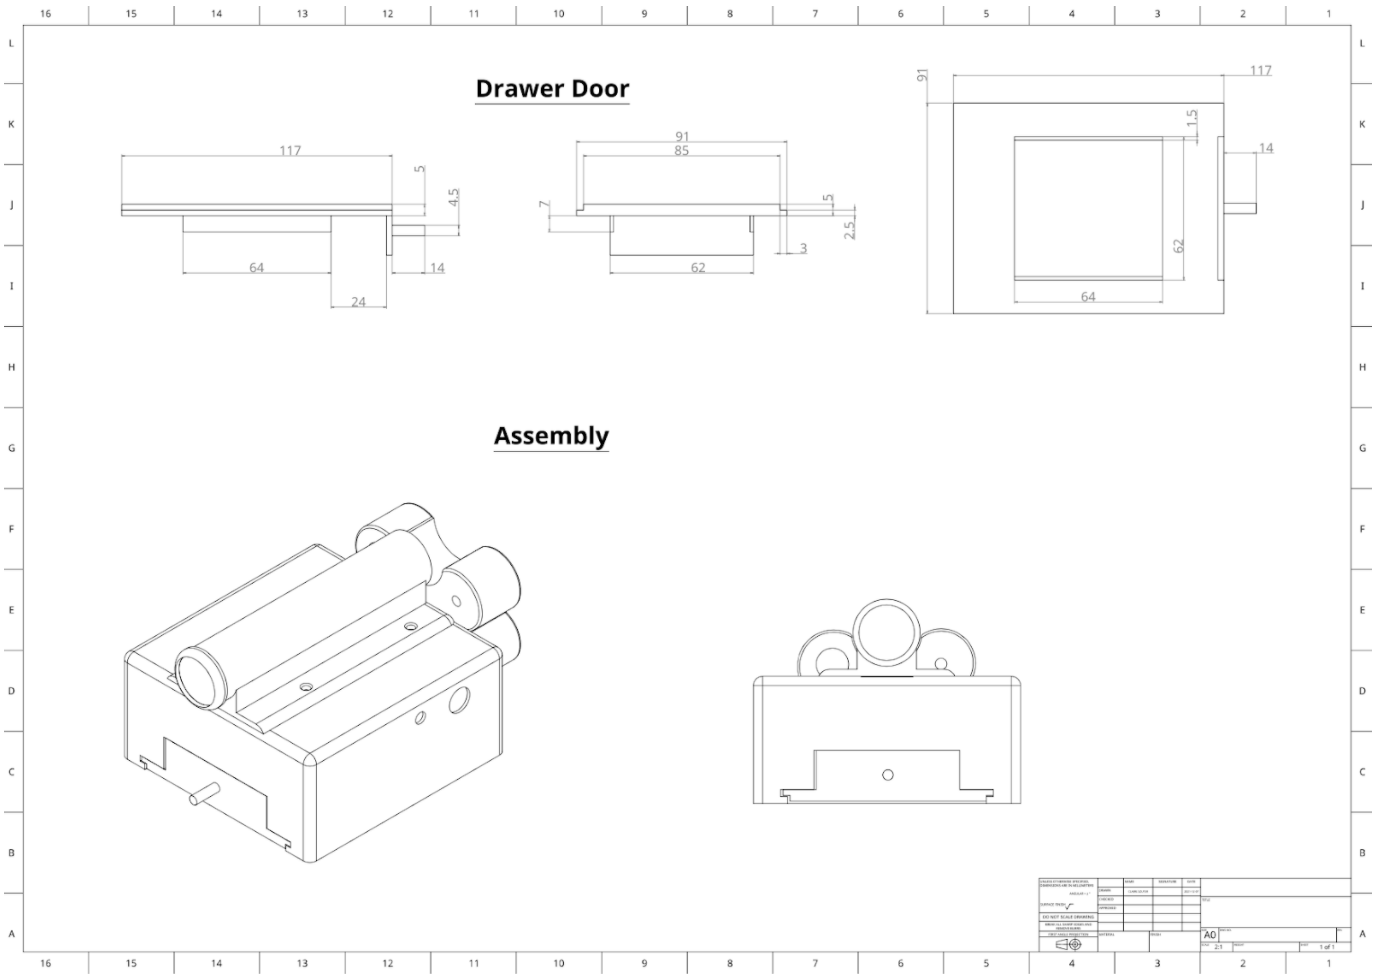
Drawing of battery drawer
1 of 3
Electronics Design
Circuit Schematic


Software Schematic


PCB and Circuit
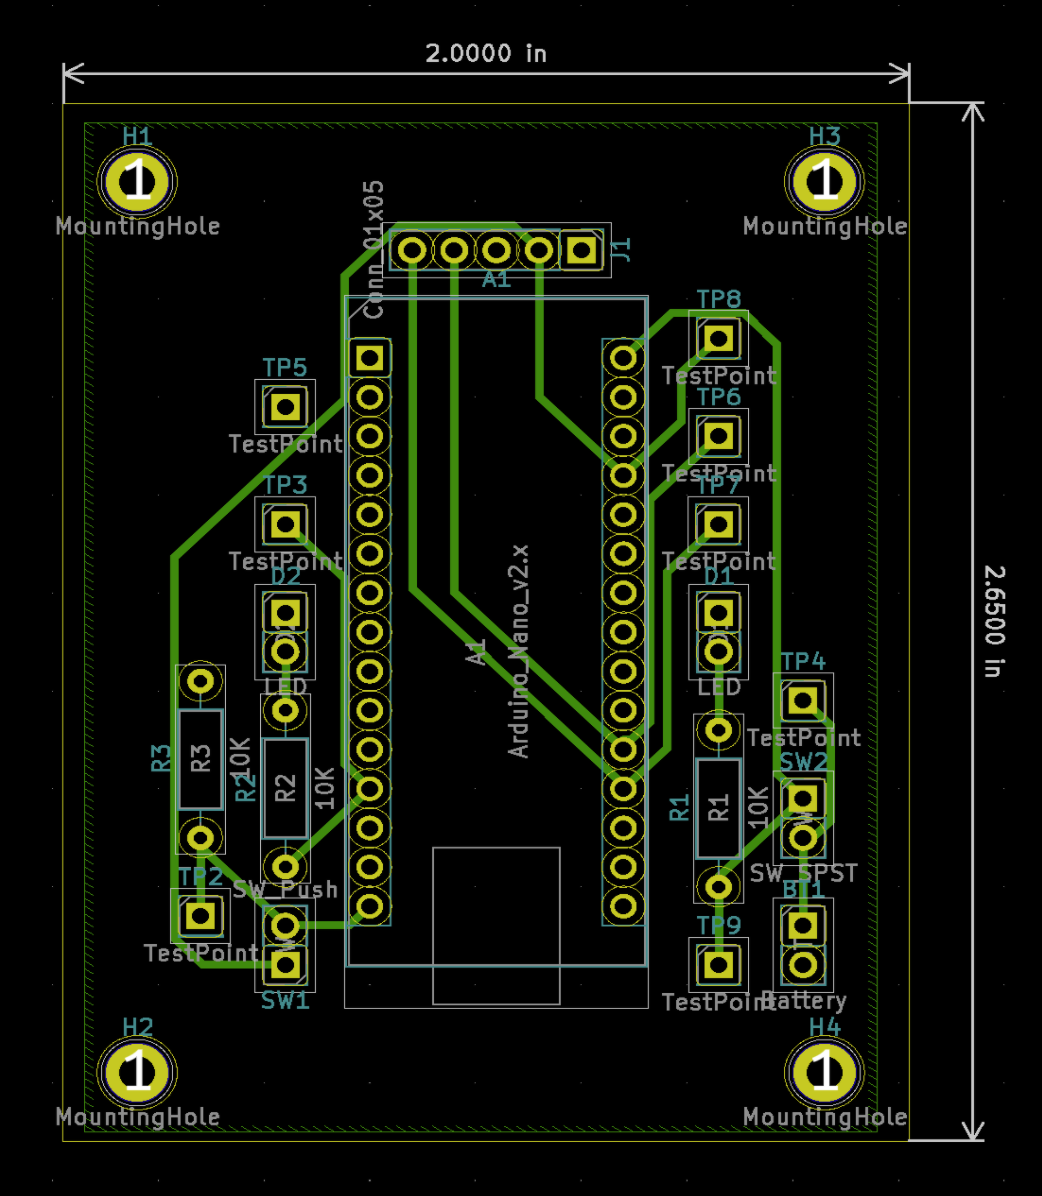
PCB generated in KiCAD
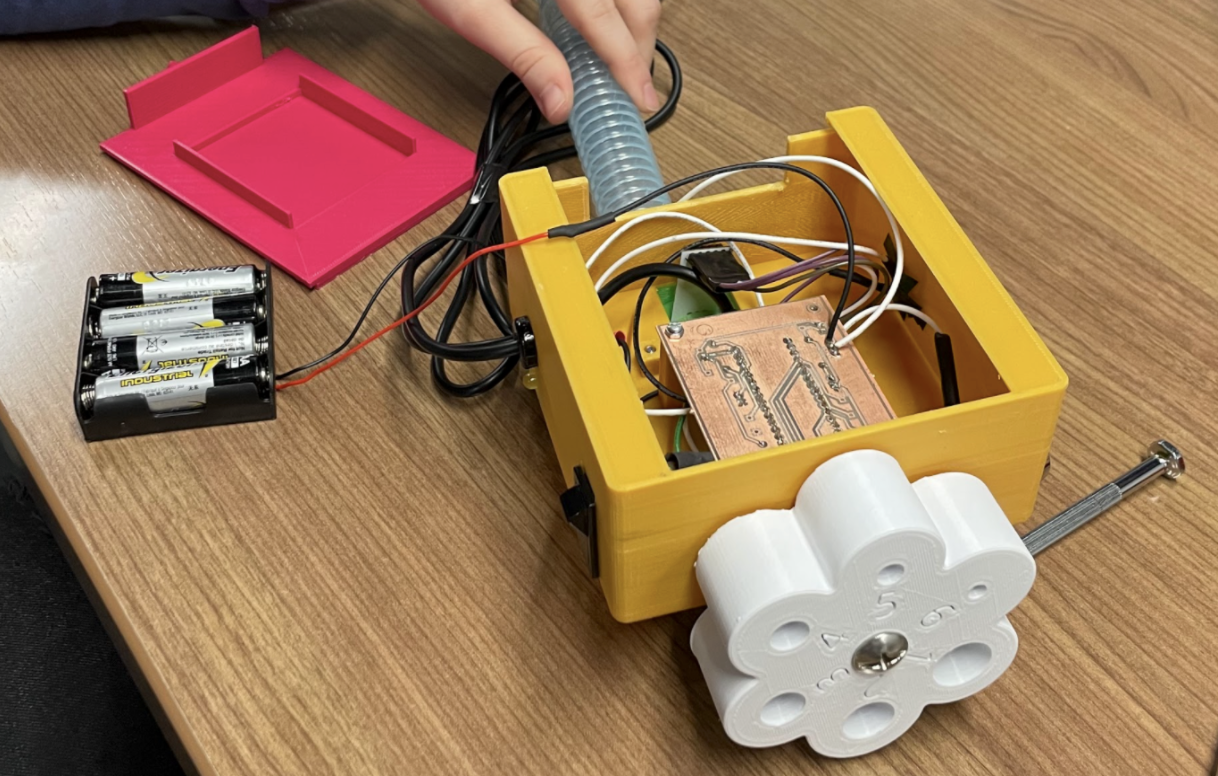
PCB in Enclosure
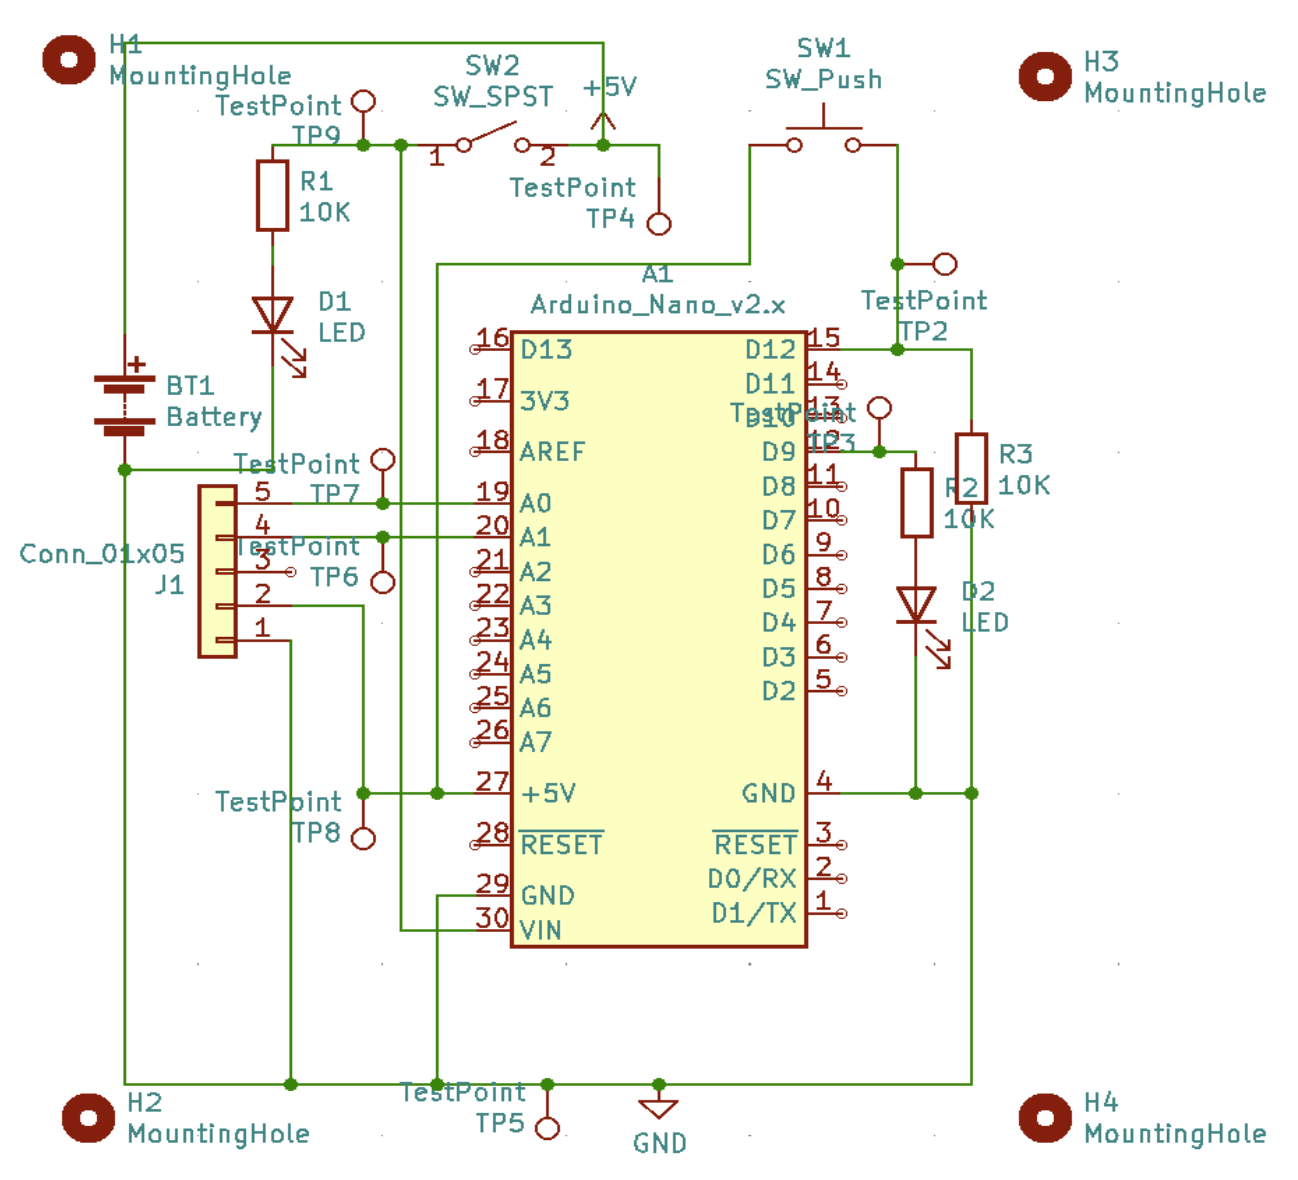
Circuit Diagram
1 of 3
Arduino Code
void loop() {
/* Measure windspeed and temperature, listen for activation of calibration button, and Serial print value

This function calls the measure(), calibrate(), and levels() functions in order to run the full code.
After running this, it Serial prints the "level" (-5 to 5) every 0.5 seconds.
*/
WindSpeed_MPH, TempC = measure();

if (digitalRead(calibrate_button)) {
  avg_temp, avg_speed, avg_overall_max_out, avg_overall_max_in = calibrate();
}

value = levels(avg_temp, avg_speed, avg_overall_max_out, avg_overall_max_in);
Serial.println(value);

delay(500);
}
Measurement Code
float measure() {
/* Read and convert windspeed and temperature from analog inputs of sensor

  This function analog reads the current windspeed and temperature and uses a series of empirically
  derived relationships to convert both windspeed to units of miles per hour and temperature to
  degrees Celsius.

  :returns: float containing windspeed in miles per hour
  :returns: float containing temperature in Celsius
*/

TMP_Therm_ADunits = analogRead(analogPinForTMP);
RV_Wind_ADunits = analogRead(analogPinForRV);
RV_Wind_Volts = (RV_Wind_ADunits*(voltage / bit_depth)); //Converts to voltage

TempCtimes100 =
(0.005*((float)TMP_Therm_ADunits*(float)TMP_Therm_ADunits))-(16.862*(float)TMP_Therm_ADunits)+9075.4;
TempC = TempCtimes100/100.0;
zeroWind_ADunits =
-0.0006*((float)TMP_Therm_ADunits*(float)TMP_Therm_ADunits)+1.0727*(float)TMP_Therm_ADunits+47.172;
zeroWind_volts = (zeroWind_ADunits*0.0048828125)-zeroWindAdjustment;
WindSpeed_MPH =  pow(((RV_Wind_Volts-zeroWind_volts)/.2300),2.7265);
return WindSpeed_MPH, TempC;
}
Calibration Code
float calibrate() {
/*
  Measure the ambient temperature and windspeed and the patient's maximum inhale and exhale windspeeds.

  This function is called when the calibration button is pressed on the device. Once the function begins,
  it outputs the wait_code to the Serial monitor, which is interpretted by the computer interface and
  tells the user to "wait." During this waiting period, it measures the ambient temperature and windspeed
  for the delay time specific by ambient_delay. Then, it sends alternating codes for exhale and inhale to
  the Serial monitor, which the user interface interprets, telling the user to breathe out and in as hard
  as possible for the delay time specifed by max_delay. During each of these delays, it measures windspeed,
  doing this 3 times in total and then averaging the values. It the outputs the average ambient temperature
  and windspeed and the maximum inhale and exhale windspeeds.

  :returns: float containing average ambient windspeed
  :returns: float containing average ambient temperature
  :returns: float containing average maximum exhale windspeed
  :returns: float containing average maximum inhale windspeed
*/
flag = 1;
starttime = millis();
Serial.println(wait_code);
while (flag == 1) { //ambient temp/speed calibration
  digitalWrite(calibrate_indicator, HIGH);
  WindSpeed_MPH, TempC = measure();
  temps_total += TempC;
  speed_total += WindSpeed_MPH;
  count += 1;
  nowtime = millis();
  if ((nowtime - starttime) >= (ambient_delay)) {
    avg_temp = temps_total / float(count);
    avg_speed = speed_total / float(count);
    count = 0;
    temps_total = 0;
    flag = 0;
    for (int i = 0; i < 3; i++) {
      Serial.println(exhale_code); //max exhale speed calibration
      delay(max_delay);
      WindSpeed_MPH, TempC = measure();
      max_speed_total += WindSpeed_MPH;
      count_max += 1;

      Serial.println(inhale_code); //max inhale speed calibration
      delay(max_delay);
      WindSpeed_MPH, TempC = measure();
      max_speed_total_in += WindSpeed_MPH;
      count_max_in += 1;

    }
    avg_overall_max_out = max_speed_total / float(count_max);
    avg_overall_max_in = max_speed_total_in / float(count_max_in);
  }
}
Serial.println(calibration_over_code);
digitalWrite(calibrate_indicator, LOW);
return avg_temp, avg_speed, avg_overall_max_out, avg_overall_max_in;
}
Calculate Levels Code
int levels(float avg_temp, float avg_speed, float avg_overall_max_out, float avg_overall_max_in) {
/*
  Calculate the level of the patient's breath based on windspeed as compared to average and maximum
  windspeeds

  This function measures the patient's current windspeed and temperature, and then sorts the breaths
  into inhales or exhales. Inhales occur when the temperature of the breath is below the ambient
  temperature, and exhales occur when the temperature of the breath is above the ambient temperature.
  Once the breaths are sorted, the range of each of the five levels is determined by calculating
  the difference between maximum windspeed and ambient windspeed and dividing by the number of levels,
  5. Then, the specific level for the current breath is calculated by dividing the current speed by the
  range previously calculated. If it is an inhale, the level is positive. If it is an exhale, the level
  is negative. If there is no breath (the current windspeed is lower than the ambient speed), the level
  is zero.

  :param avg_temp: float containing the ambient temperature in Celsius
  :param avg_speed: float containing the ambient windspeed in miles per hour
  :param avg_overal_max_out: float containing average maximum exhale windspeed
  :param avg_overal_max_in: float containing average maximum inhale windspeed
  :param num_levels: int containing the total number of levels (usually 5)
*/

float range_in = 1.0;
float range_out = 1.0;

WindSpeed_MPH, TempC = measure();

if (WindSpeed_MPH > avg_speed && TempC <= avg_temp) { //breathing in
  range_in = (avg_overall_max_in - avg_speed) / float(num_levels);
  value = WindSpeed_MPH / range_in;
}
else if (WindSpeed_MPH > avg_speed && TempC >= avg_temp) { //breathing out
  range_out = (avg_overall_max_out - avg_speed) / float(num_levels);
  value = -WindSpeed_MPH / range_out;
}
else if (WindSpeed_MPH < avg_speed) {
  value = 0;
}
return value;
}
Graphical User Interface
Welcome and Calibration


Menu and Reminder


Summary and Output


The user sees a welcome screen first and then must calibrate the device by pressing the button on the side of the enclosure. This measures ambient wind speed and temperature and the user's maximum inhale and exhale wind speed. The user then uses the menu to see the device instructions and enters name, "Great Inhale" and "Great Exhale" thresholds, song choice, desired length of adequate breath, and resistance level that the device is already set to. There is a popup that reminds the user to match the physical resistance knob on the device to the resistance entered on the GUI.
Main Page with Graphical Display


When the user presses the "Start" button on the main page, the program plays the song selected from the previous menu and displays dots on the bottom half of the screen that tell the user when to inhale, exhale, and rest. As the user breathes, their windspeed relative to the calibrated ambient speed and calibrated max inhale/exhale speed is displays in the graph. Each time the user goes above the inhale threshold for a sufficient amount of time, as specified by one of the entry fields in the menu, they get a "Great Inhale!" message in the top right corner, and the same is true for a great exhale.
The user can pause the program or end the session, revealing a summary of their performance. This summary can then be saved as a text file to their computer.
Testing
Testing Procedure for Functionality


Testing Procedure for Compliance and Design


Schematics
Duration of Breath


Wind Speed Accuracy


Air Resistance


Results


Parts List


Marginal/competitve value ($50) met
Bland-Altman Plots
Bland-Altman plots were generated for exhale and inhale duration comparing results recorded with the timer versus the GUI. These plots are shown in the figure below. From these plots, it is clear that almost all of the data points showing the difference between the two recording methods fall within the limits of agreement, indicating that most of the variation was due to the testing methods themselves. This suggests that the GUI breath duration display shows little bias and is accurate with respect to the “gold standard” timer measurements.


To further test the immediacy of visual feedback, statistical analysis was done on the time for the Serial monitor to change from an inhale to exhale measurement. Bland-Altman plots in the below figure show the difference in this time, taken by a stopwatch, between consecutive measurements. Once again, since almost all of the data points fall within the limits of agreement, most of the variation is due to the stopwatch recording method itself, suggesting that the speed of visual feedback has little bias and is relatively precise.


Ideation
Brainstorming
All Blocks


Filtered Design Blocks


Pugh Matrix


Proof of Principle
Physical Device


GUI


Progress Report


Low-Fidelity Prototypes
Looks-Like
Transductive Element

GUI

Feels-Like

Mid-Fidelity Prototypes
CAD

Breadboard

GUI

High-Fidelity Prototype


The changes between the high-fidelity and final prototype were based on our discussions with the NMTs as well as with Dr. Palmeri after our high-fidelity presentation. Visual aspects (button sizes, colors, and text boxes) of the GUI made up most of the noticeable changes, as well as the minor CAD alterations to make the pieces easier to remove and clean. A shorter tube was used because preliminary testing revealed large inaccuracies since the temperature and wind speed of a breath changed drastically before reaching the sensor when a long tube was used.
Final Product
Diagram


Video Demonstration
Regulatory
Hazard Analysis


FMEA


Fault Tree Analysis


Reflection
We have passed along our final device to the NMTs at MedRhythms for a review and assessment, and we are in the process of filing an Invention Disclosure Form. For a future design, a few improvements could be made. For the hardware, a more robust sensor that does not use temperature (which can fluctuate drastically between patients and uses) could be used to decrease feedback delay. For the GUI, an algorithm that crafts treatment plans based on results of previous sessions could be designed in addition to an algorithm that informs the patient if their breaths are on beat or not. A simple zip file and user guide could be created for easy software installation, and audio cues for inhaling and exhaling could be added to the GUI. Finally, given the difficulties with the tkinter GUI package, a different, more robust package could be used in the future. As for the enclosure, a stand could be designed to ensure that the patient does not have to crane their neck when the device is sitting on the table. Smaller resistance holes can be made to increase the force with which patients must breathe, and an encoder or motor could be used to electrically match the resistance level on the physical device and on the GUI. Finally, the sensor could be physically isolated in the housing to ensure quick and easy removal/replacement.